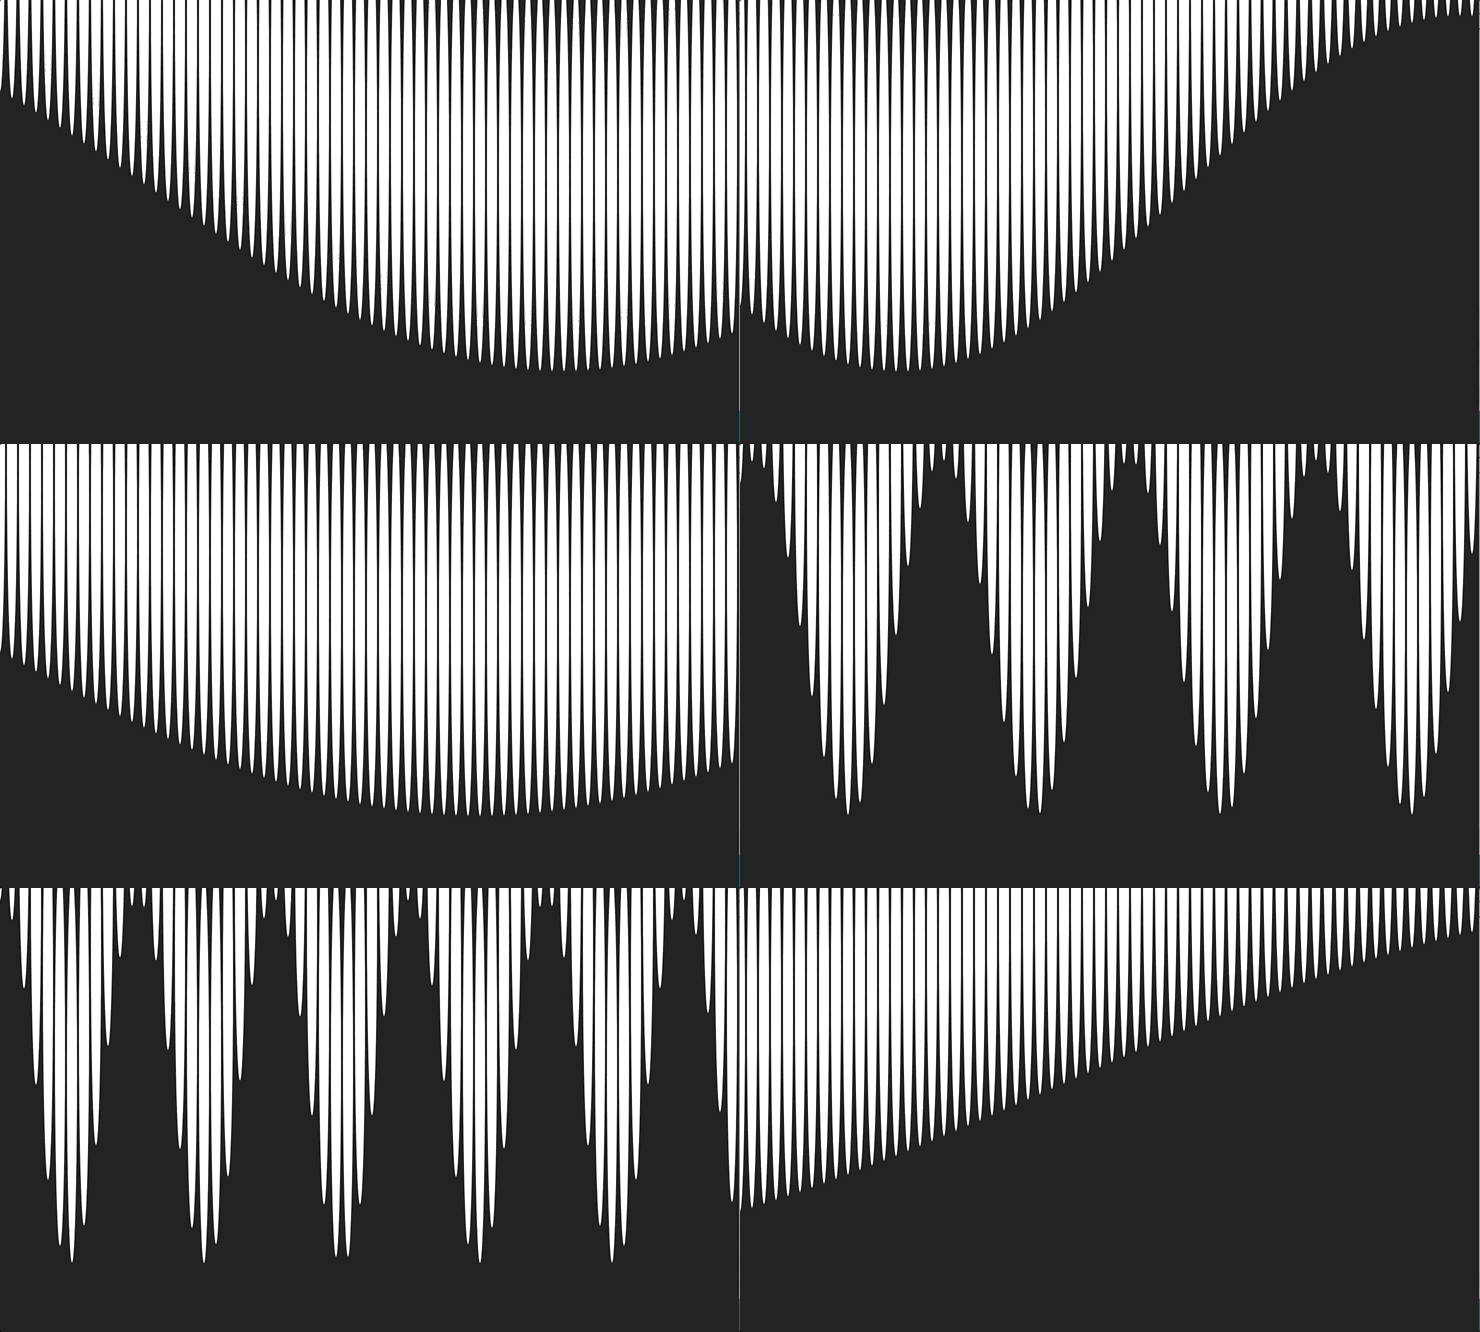
This is the code
Next Steps
The next step of this project is to use serial connection the pressure sensors on the clay shape and manipulate the amplitude, width, and speed of the wave.
Code (with Errors)
var xspacing = 12; // Distance between each horizontal location
var w; // Width of entire wave
var theta = 0; // Start angle at 0
var amplitude = 75.0; // Height of wave
var period = 400.0; // How many pixels before the wave repeats
var dx; // Value for incrementing x
var yvalues; // Using an array to store height values for the wave
var sensor1;
var sensor2;
var inData;
function setup() {
createCanvas(710, 400);
w = width+12;
dx = (TWO_PI / period) * xspacing;
// dx =1;
yvalues = new Array(floor(w/xspacing));
// print(dx);
}
//end of setup
function draw() {
//background(344, 54, 23);
background(22, 22, 243);
calcWave();
renderWave();
sensor1 = map(inData, 0, width, 0, 5);
// sensor2 = map(mouseY, 0, height, 1, 3);
}
function calcWave() {
// Increment theta (try different values for
// 'angular velocity' here)
theta += 0.02;
// For every x value, calculate a y value with sine function
var x = theta;
for (var i = 0; i < yvalues.length; i++) {
yvalues[i] = sensor2*sin(x * sensor1) * amplitude ;
x+=dx;
}
}
// for incoming serial data
function setup() {
createCanvas(500, 300);
colorMode(HSB,255,255,255);
serial = new p5.SerialPort(); // make a new instance of the serialport library
serial.on('list', printList); // set a callback function for the serialport list event
serial.on('connected', serverConnected); // callback for connecting to the server
serial.on('open', portOpen); // callback for the port opening
serial.on('data', serialEvent); // callback for when new data arrives
serial.on('error', serialError); // callback for errors
serial.on('close', portClose); // callback for the port closing
serial.list(); // list the serial ports
serial.open(portName); // open a serial port
circlecolor = color(inData, 200, 200);
w = width+12;
dx = (TWO_PI / period) * xspacing;
// dx =1;
yvalues = new Array(floor(w/xspacing));
// print(dx);
}
function renderWave() {
noStroke();
fill(255);
// A simple way to draw the wave with an ellipse at each location
for (var x = 0; x < yvalues.length; x++) {
ellipse(x*xspacing, height/105+yvalues[x], 10, -390);
}
}
CODE THAT DOES WORK (but only maps to one sensor)
var xspacing = 12; // Distance between each horizontal location
var w; // Width of entire wave
var theta = 0; // Start angle at 0
var amplitude = 75.0; // Height of wave
var period = 400.0; // How many pixels before the wave repeats
var dx; // Value for incrementing x
var yvalues; // Using an array to store height values for the wave
var sensor1;
var sensor2;
function setup() {
createCanvas(710, 400);
w = width+12;
dx = (TWO_PI / period) * xspacing;
// dx =1;
yvalues = new Array(floor(w/xspacing));
// print(dx);
}
//end of setup
function draw() {
//background(344, 54, 23);
background(22, 22, 243);
calcWave();
renderWave();
sensor1 = map(mouseX, 0, width, 0, 5);
sensor2 = map(mouseY, 0, height, 1, 3);
}
function calcWave() {
// Increment theta (try different values for
// 'angular velocity' here)
theta += 0.02;
// For every x value, calculate a y value with sine function
var x = theta;
for (var i = 0; i < yvalues.length; i++) {
yvalues[i] = sensor2*sin(x * sensor1) * amplitude ;
x+=dx;
}
}
function renderWave() {
noStroke();
fill(255);
// A simple way to draw the wave with an ellipse at each location
for (var x = 0; x < yvalues.length; x++) {
ellipse(x*xspacing, height/105+yvalues[x], 10, -390);
}
}


