Copy of Pattern and Sound Series - P5js and Tone.jsl

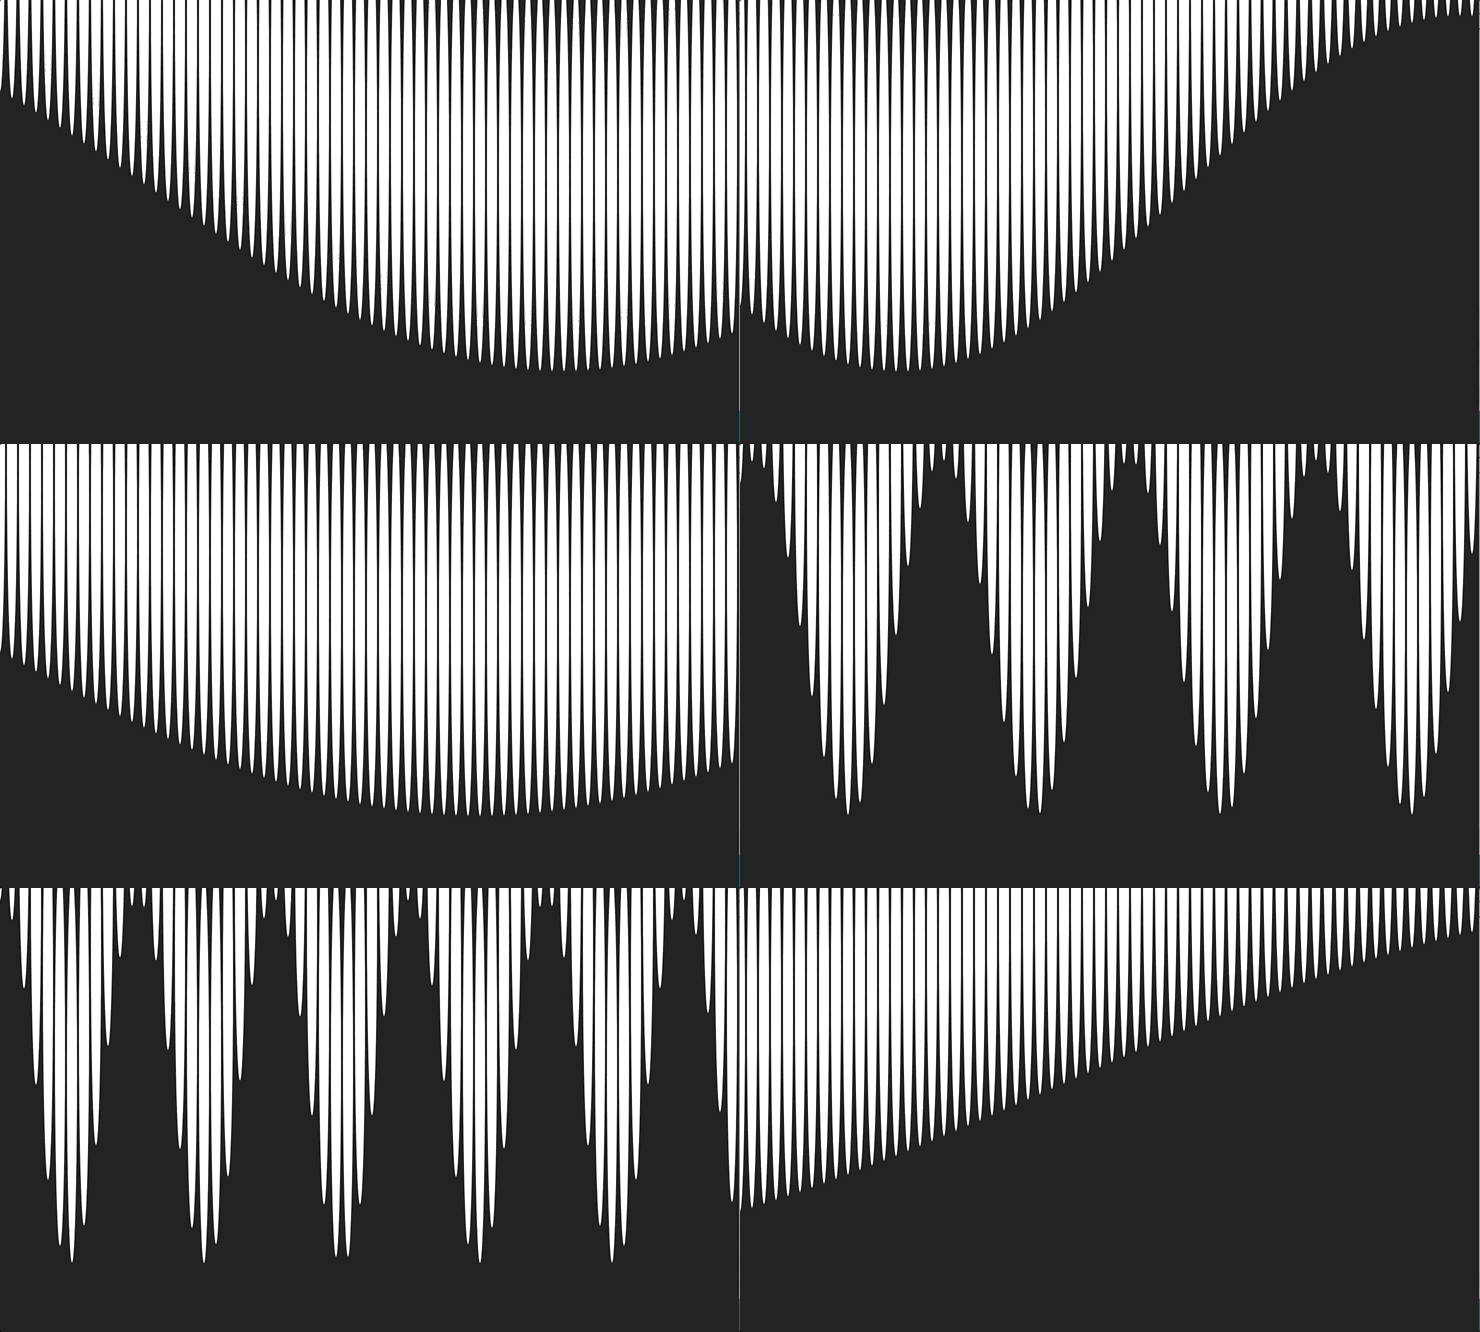
Using p5js and Tone.js, I created a series of compositions that reconfigure temporarily on input from Kinect, a motion sensor, and generate soothing and energizing synthetic sounds that match the visual elements of the piece. The people in front of the projected visuals and sensor, in effect, create sonic compositions simply by moving, almost like a conductor in front of an orchestra but with more leeway for passive (if one simply walks by) or intentional  interaction.

The sound is easy to ignore or pay attention to. It is ambient and subtle. 

The next steps are to create more nuanced layers of interactivity that allow for more variation of manipulation of the sound and the visuals. Right now I am envisioning the piece becoming a subtle sound orchestra that one can conduct with various hand movements and locations of the screen. 

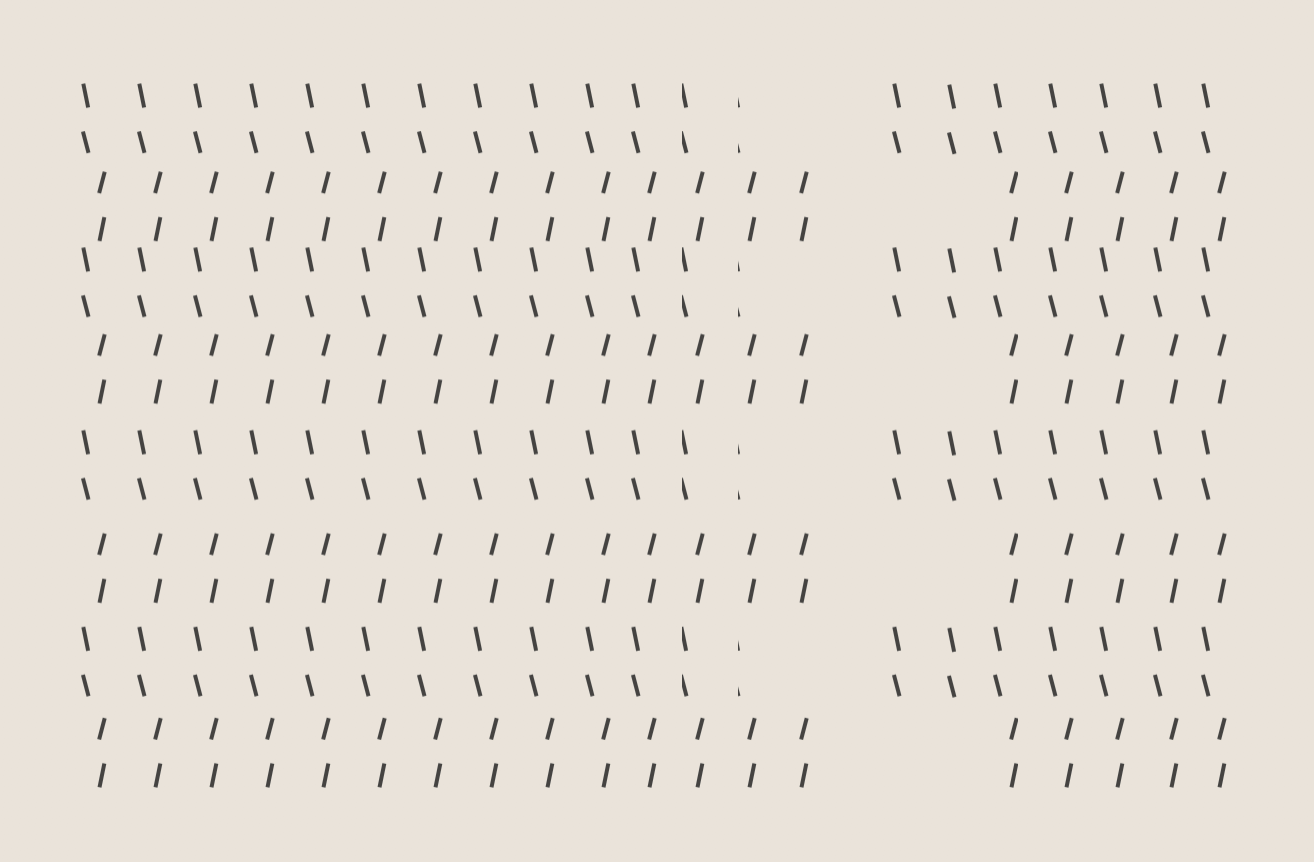
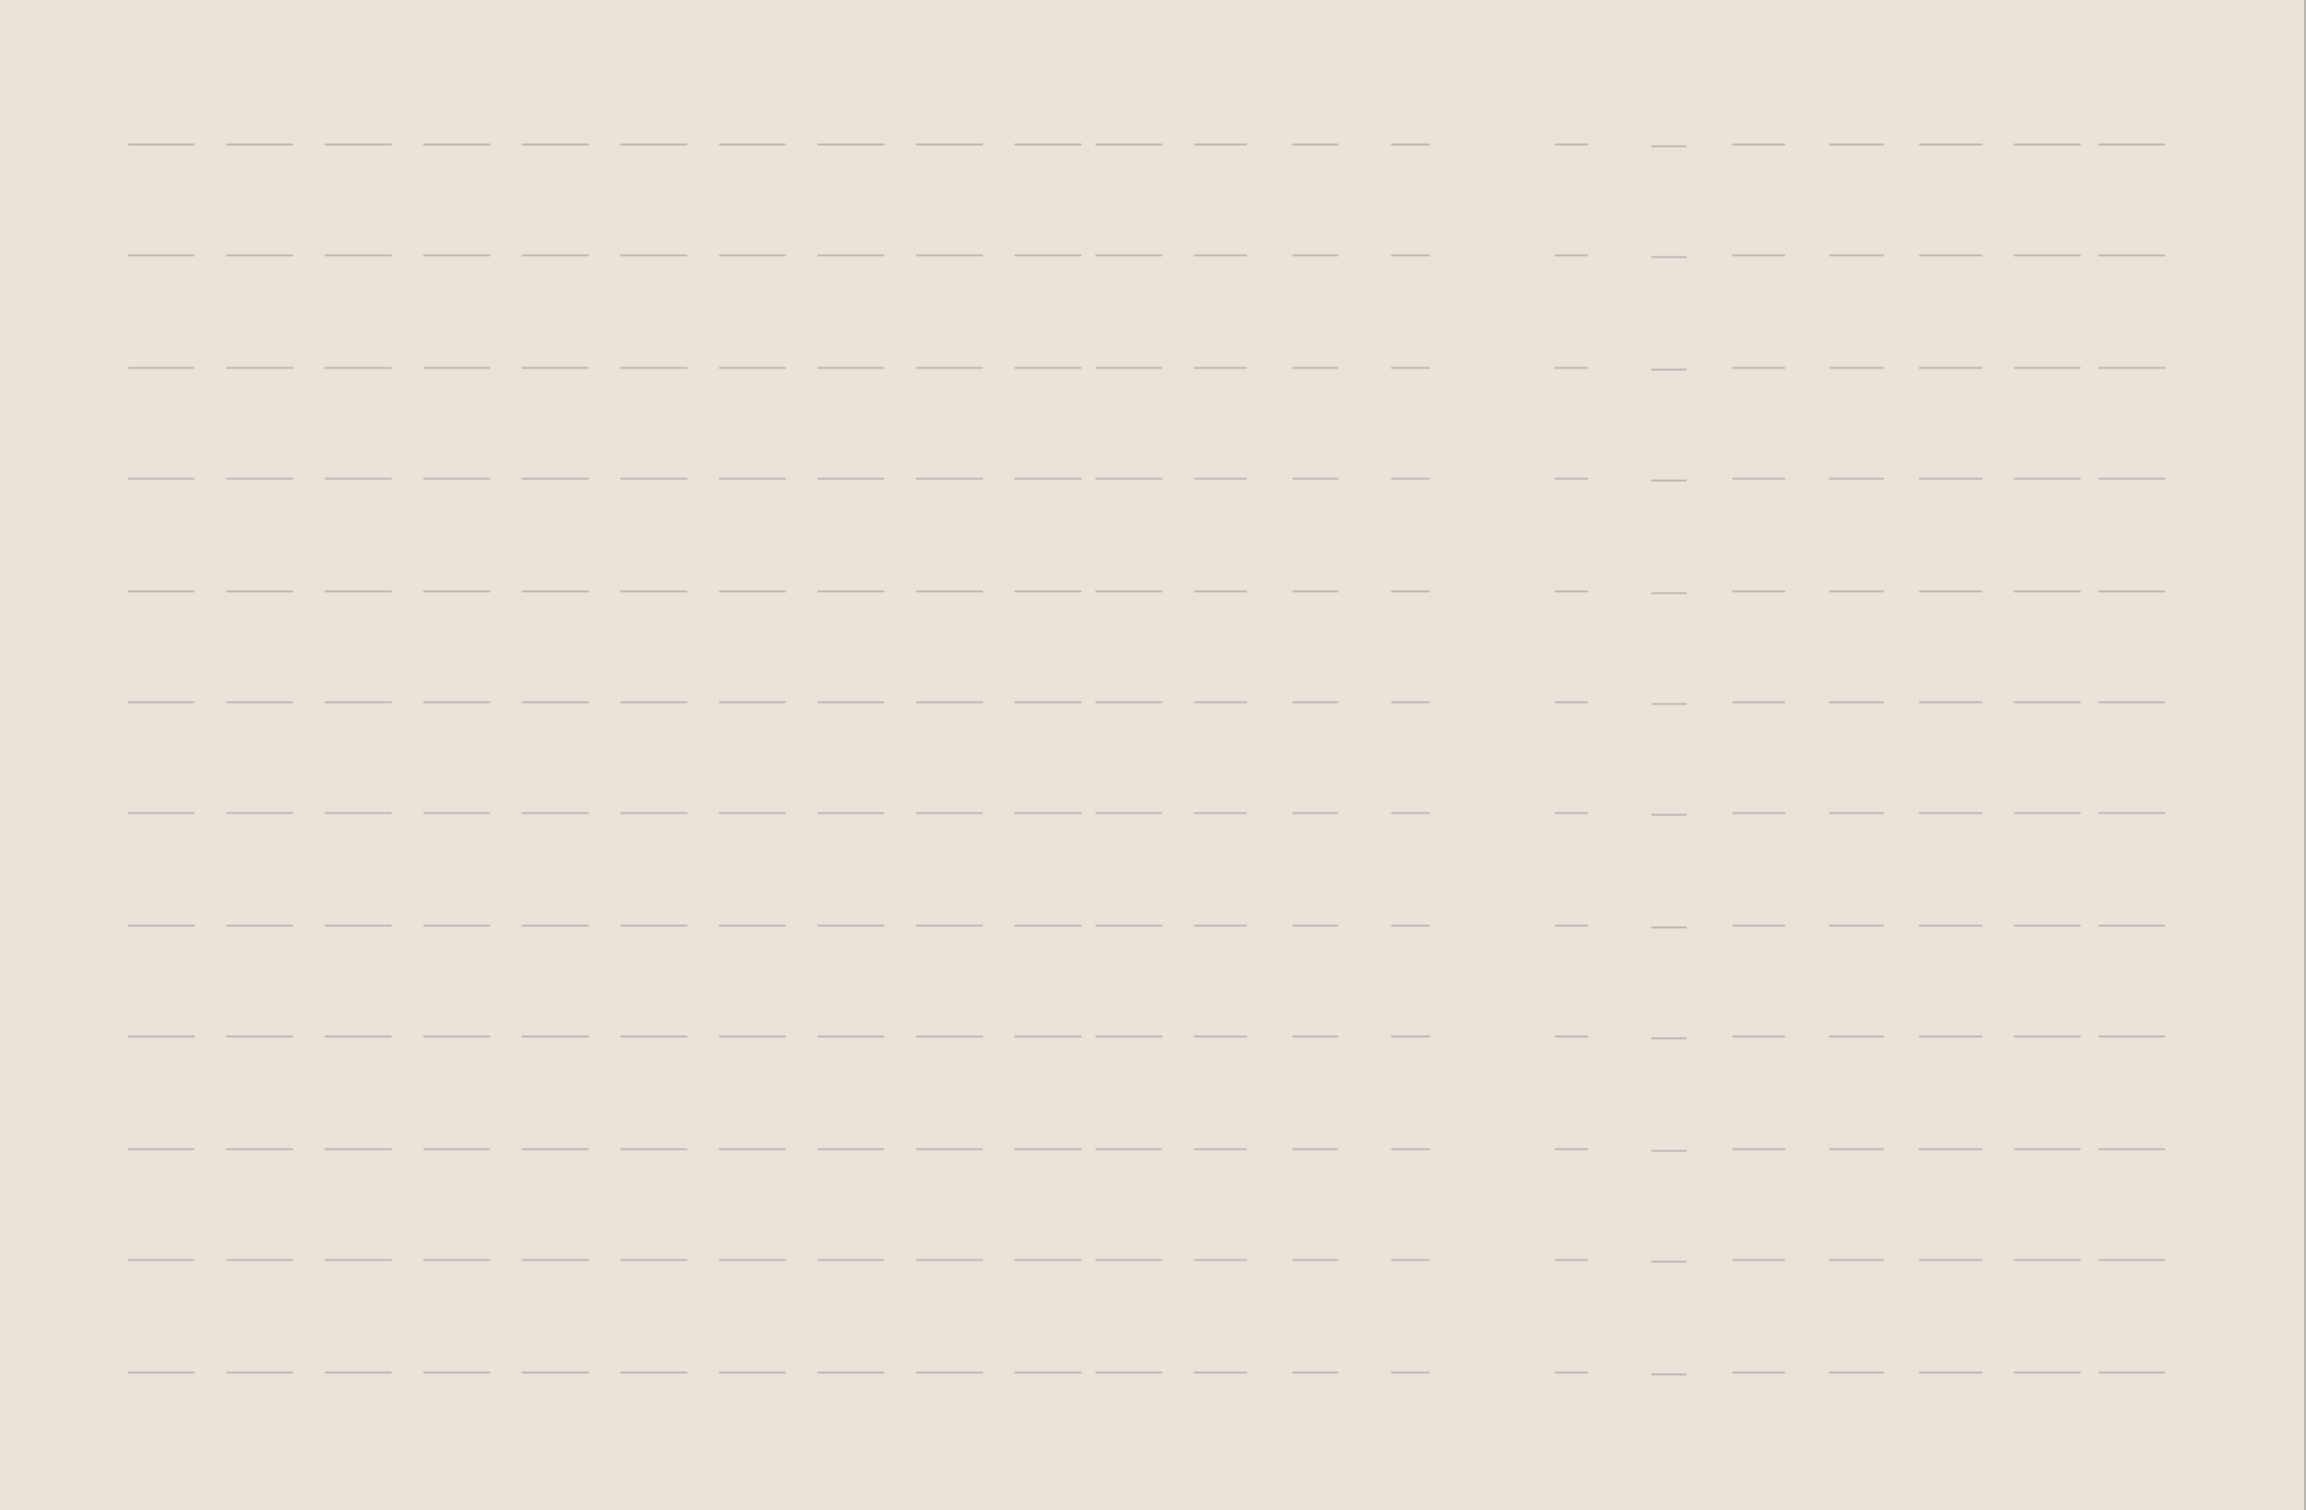
Composition 1: Ode to Leon's OCD

In the editor.

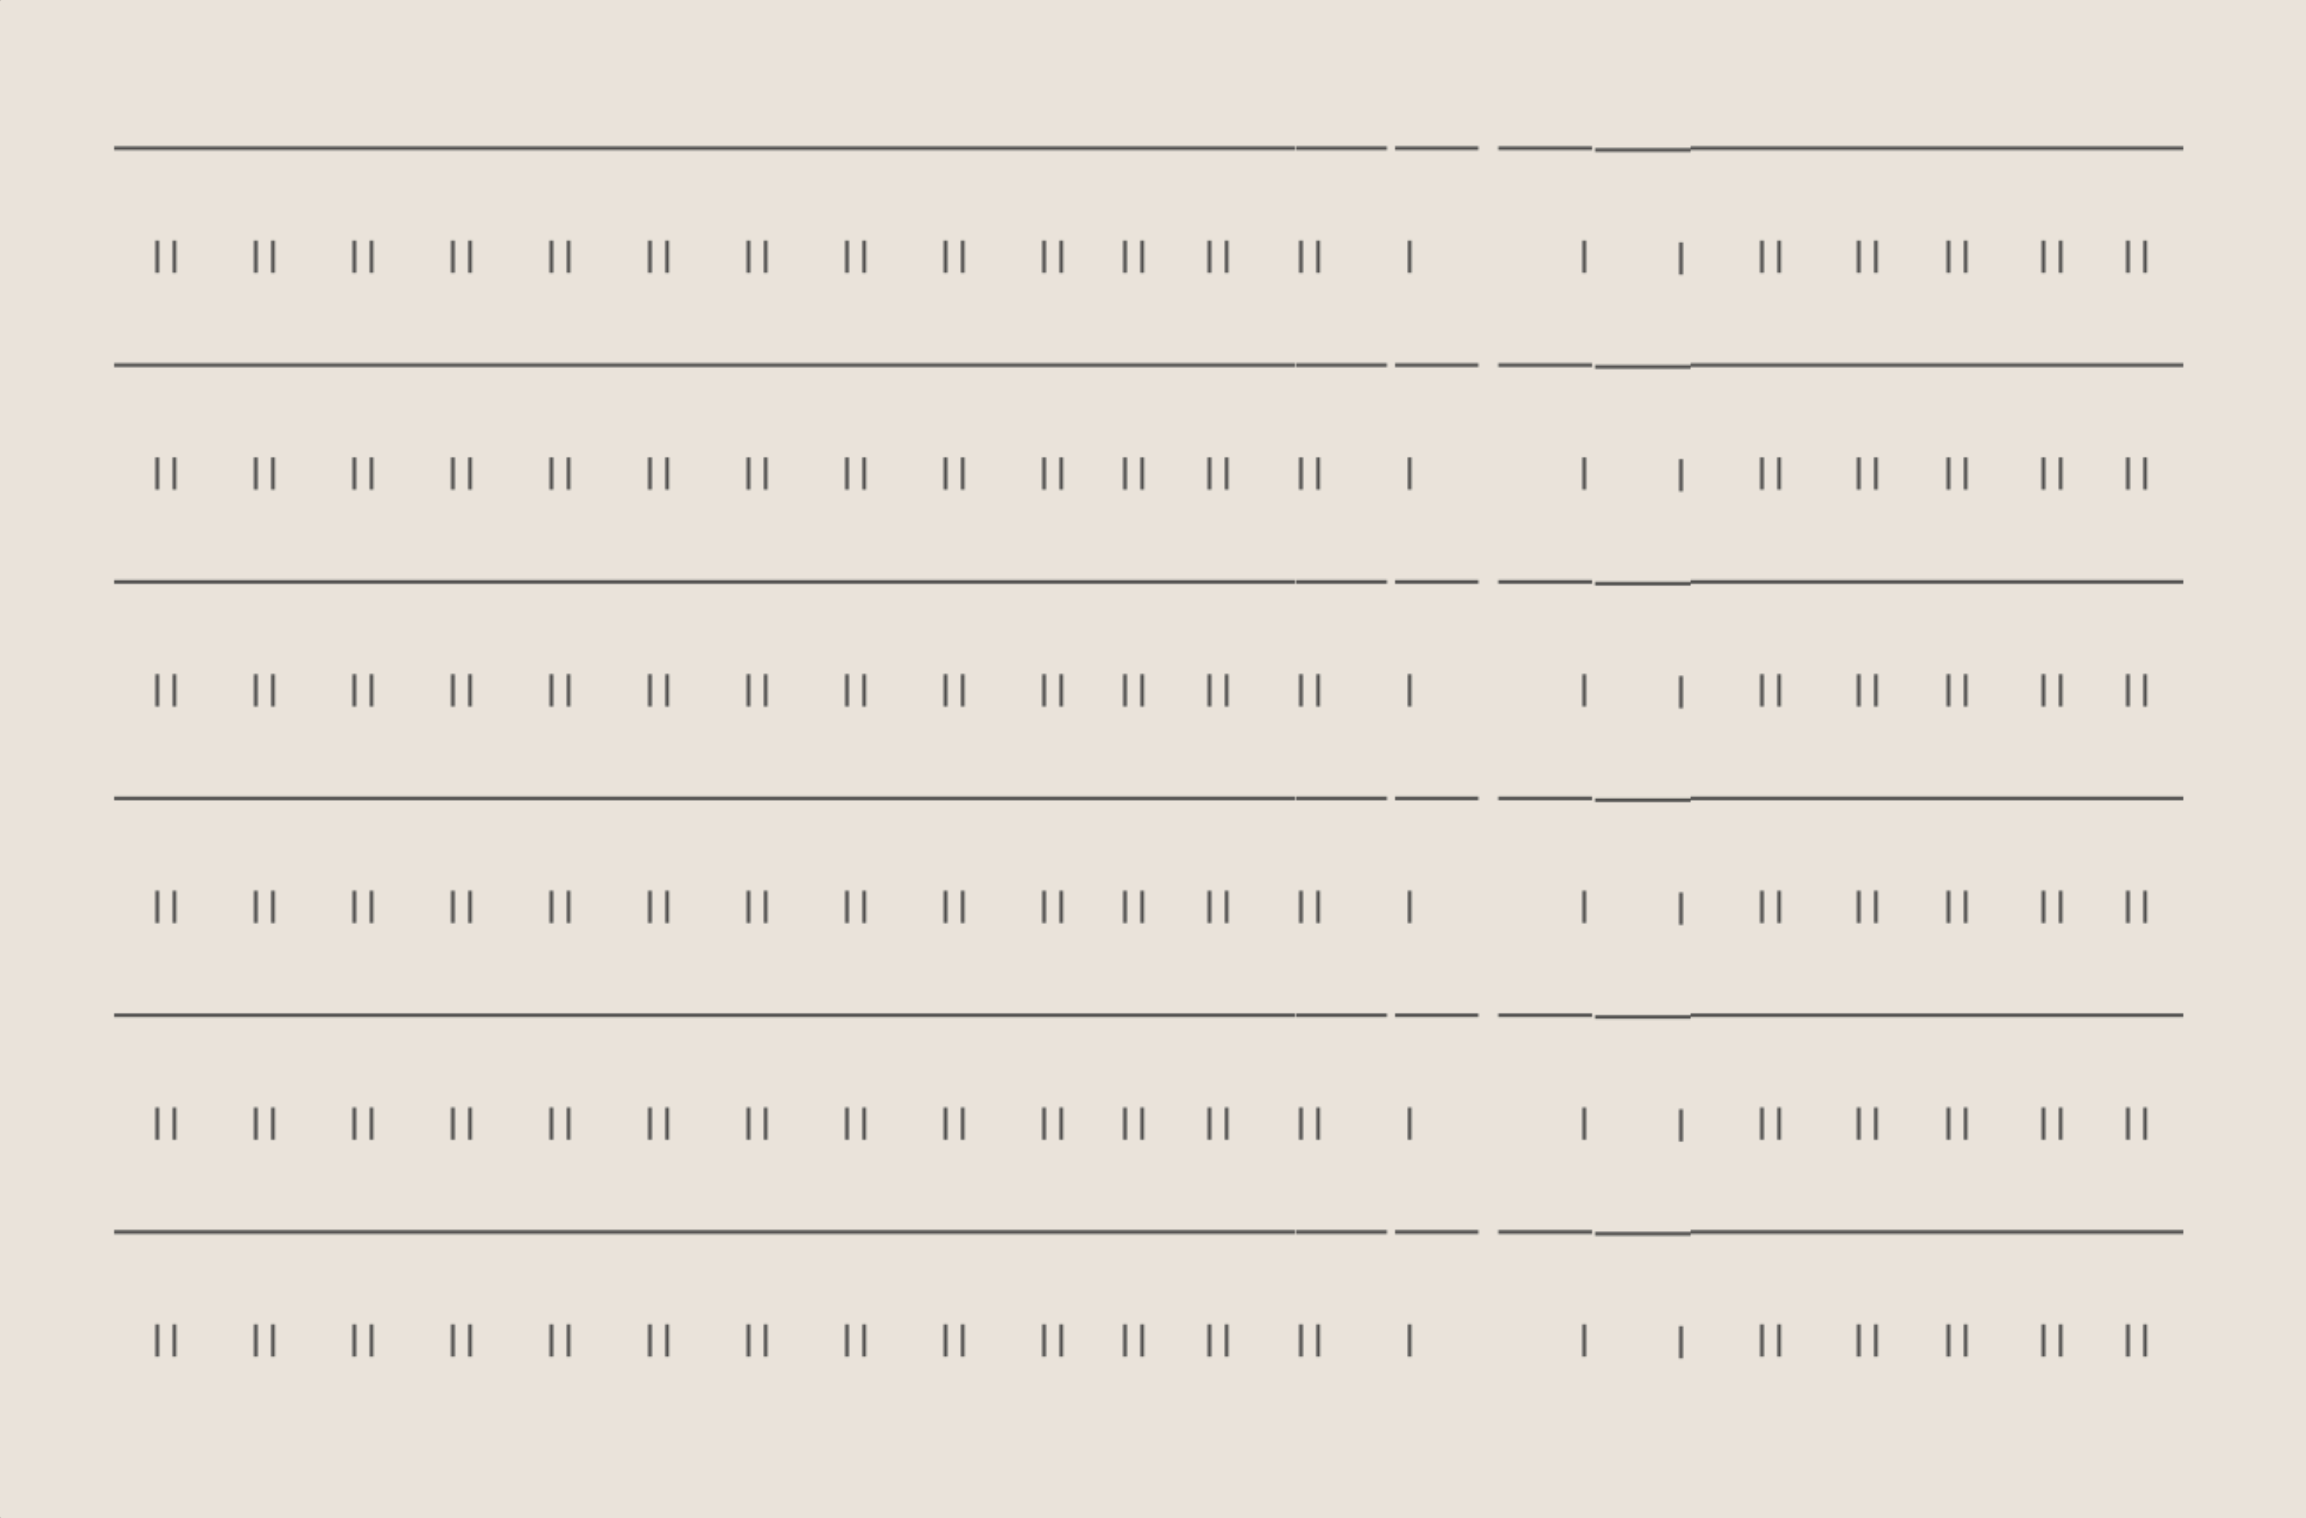
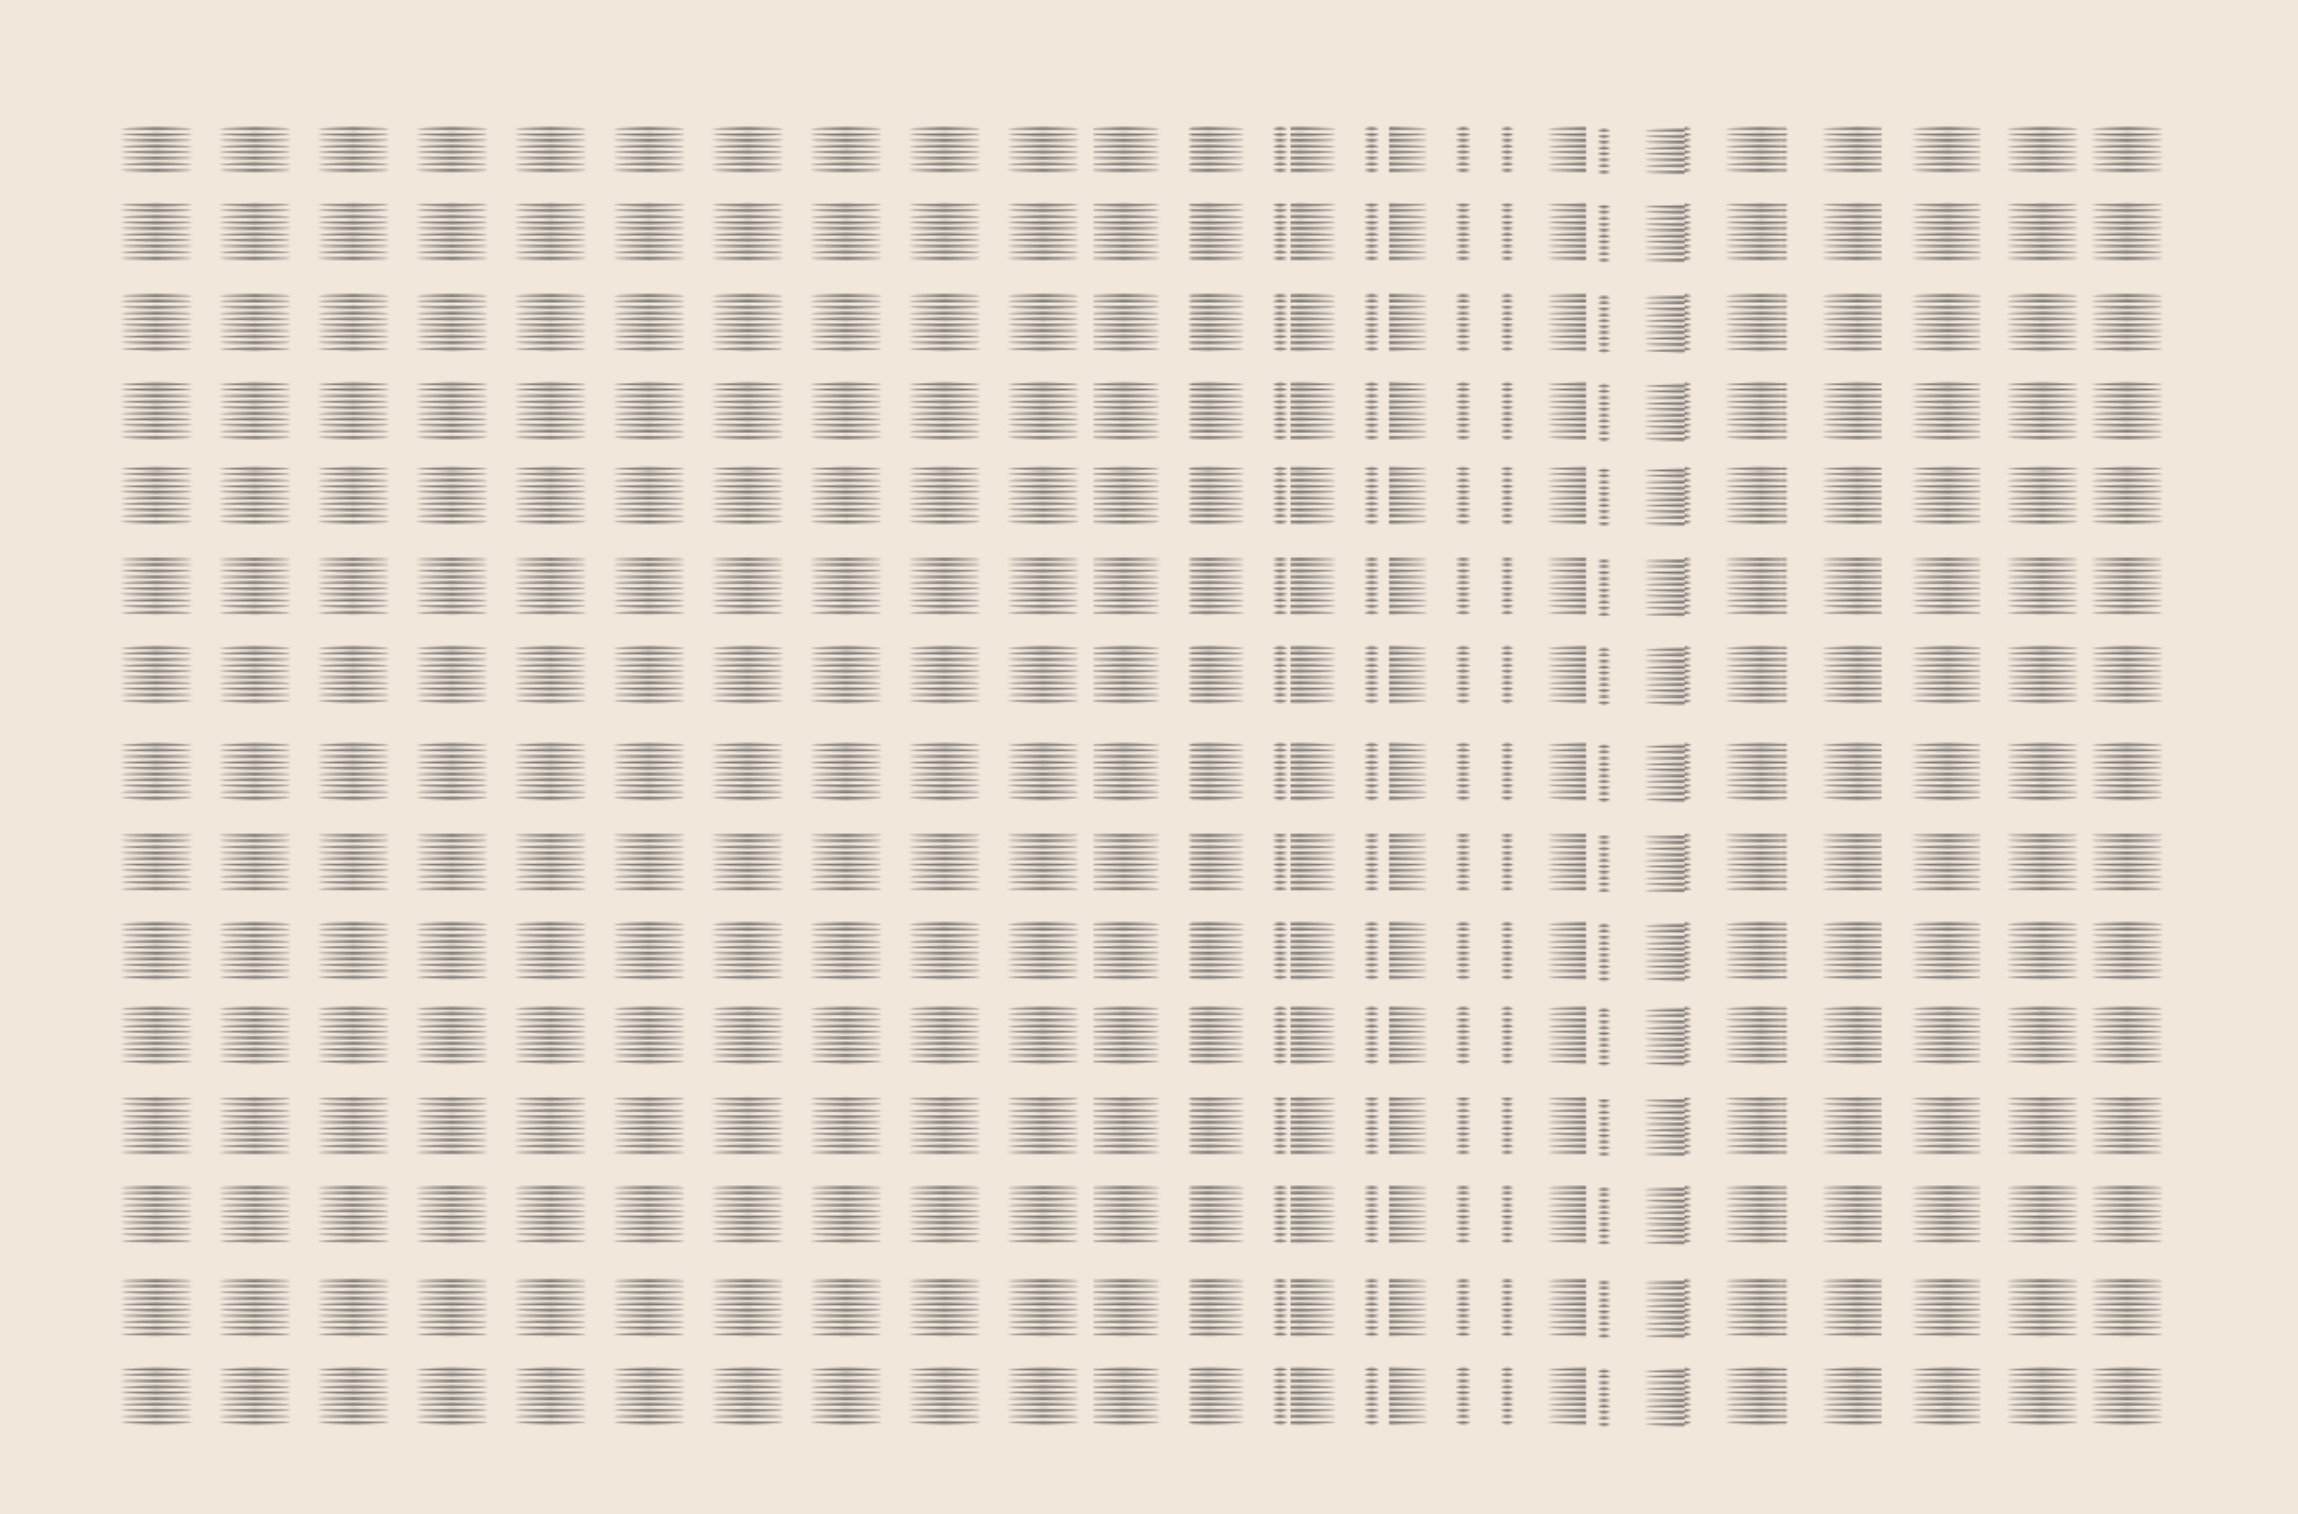
Composition 2: Allison's Use of Vim Editor

Mouseover version for testing on the computer.

In the editor using Kinect.

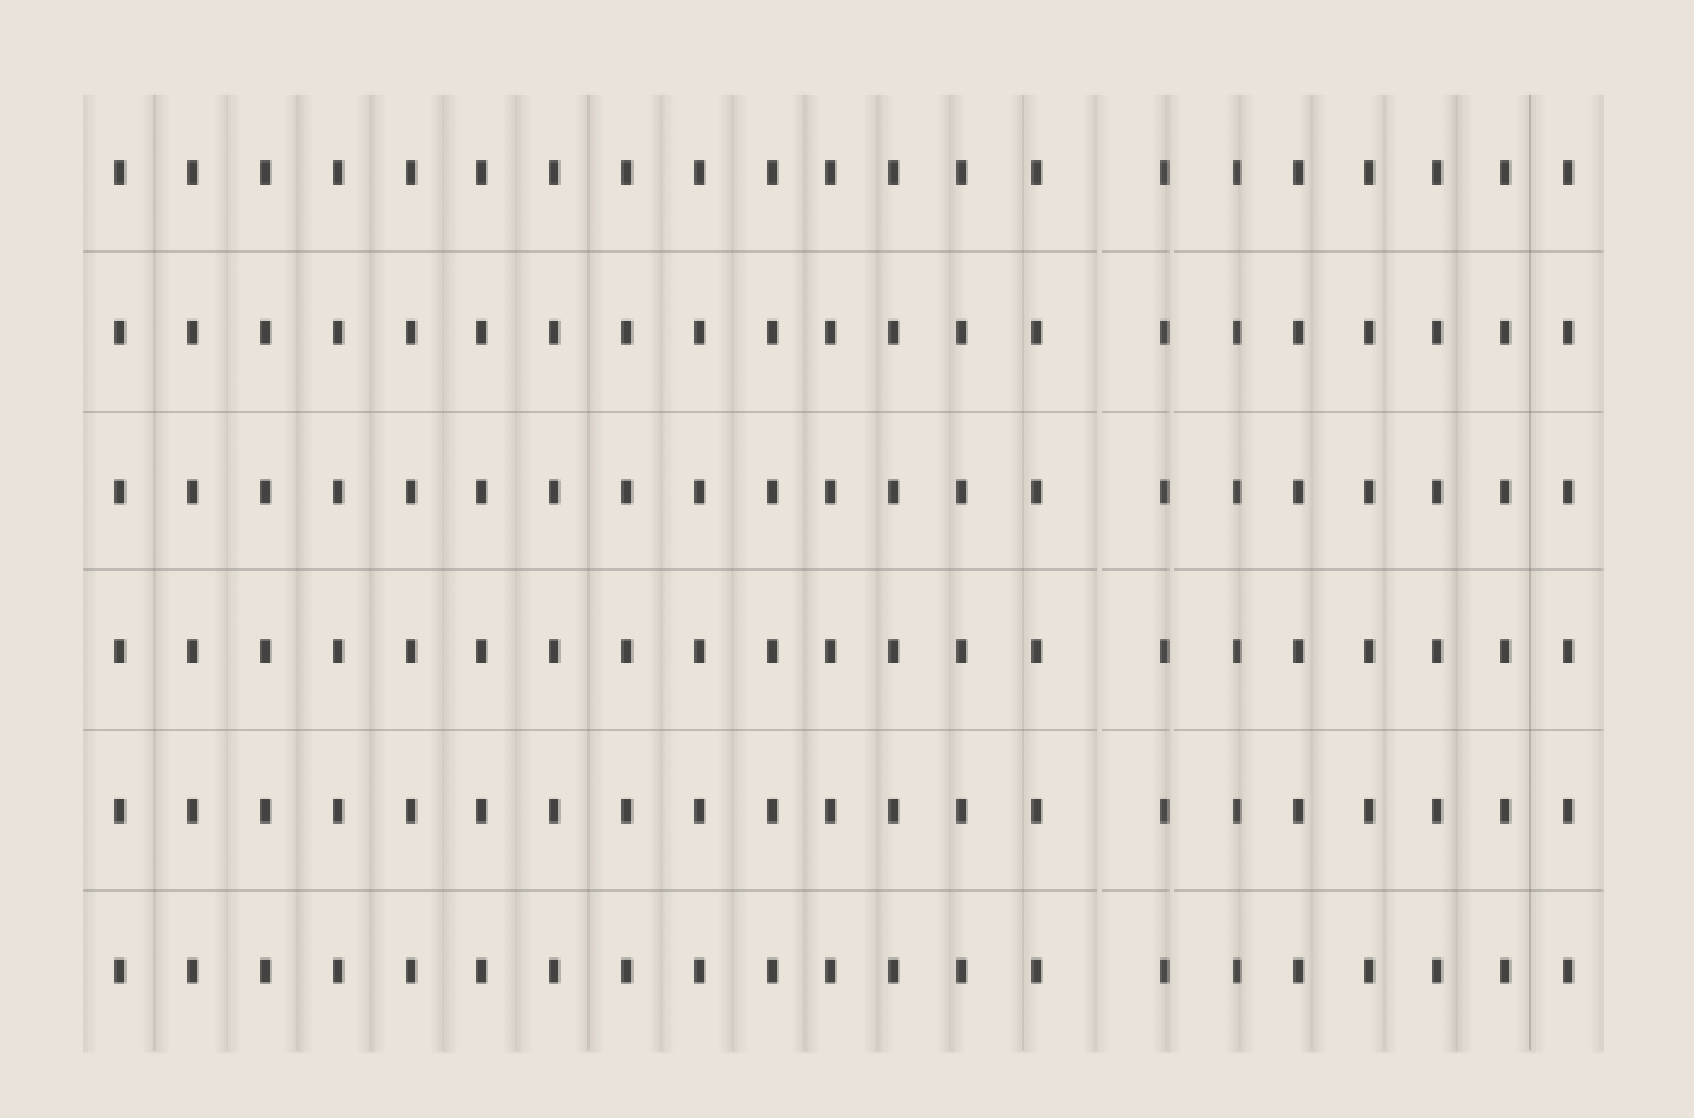
Composition 4. "Brother"

In the p5js editor.

For this synchopated piece I sampled sounds of tongue cliks and and claps found on freesound.org. No tone.js was used in this piece.  

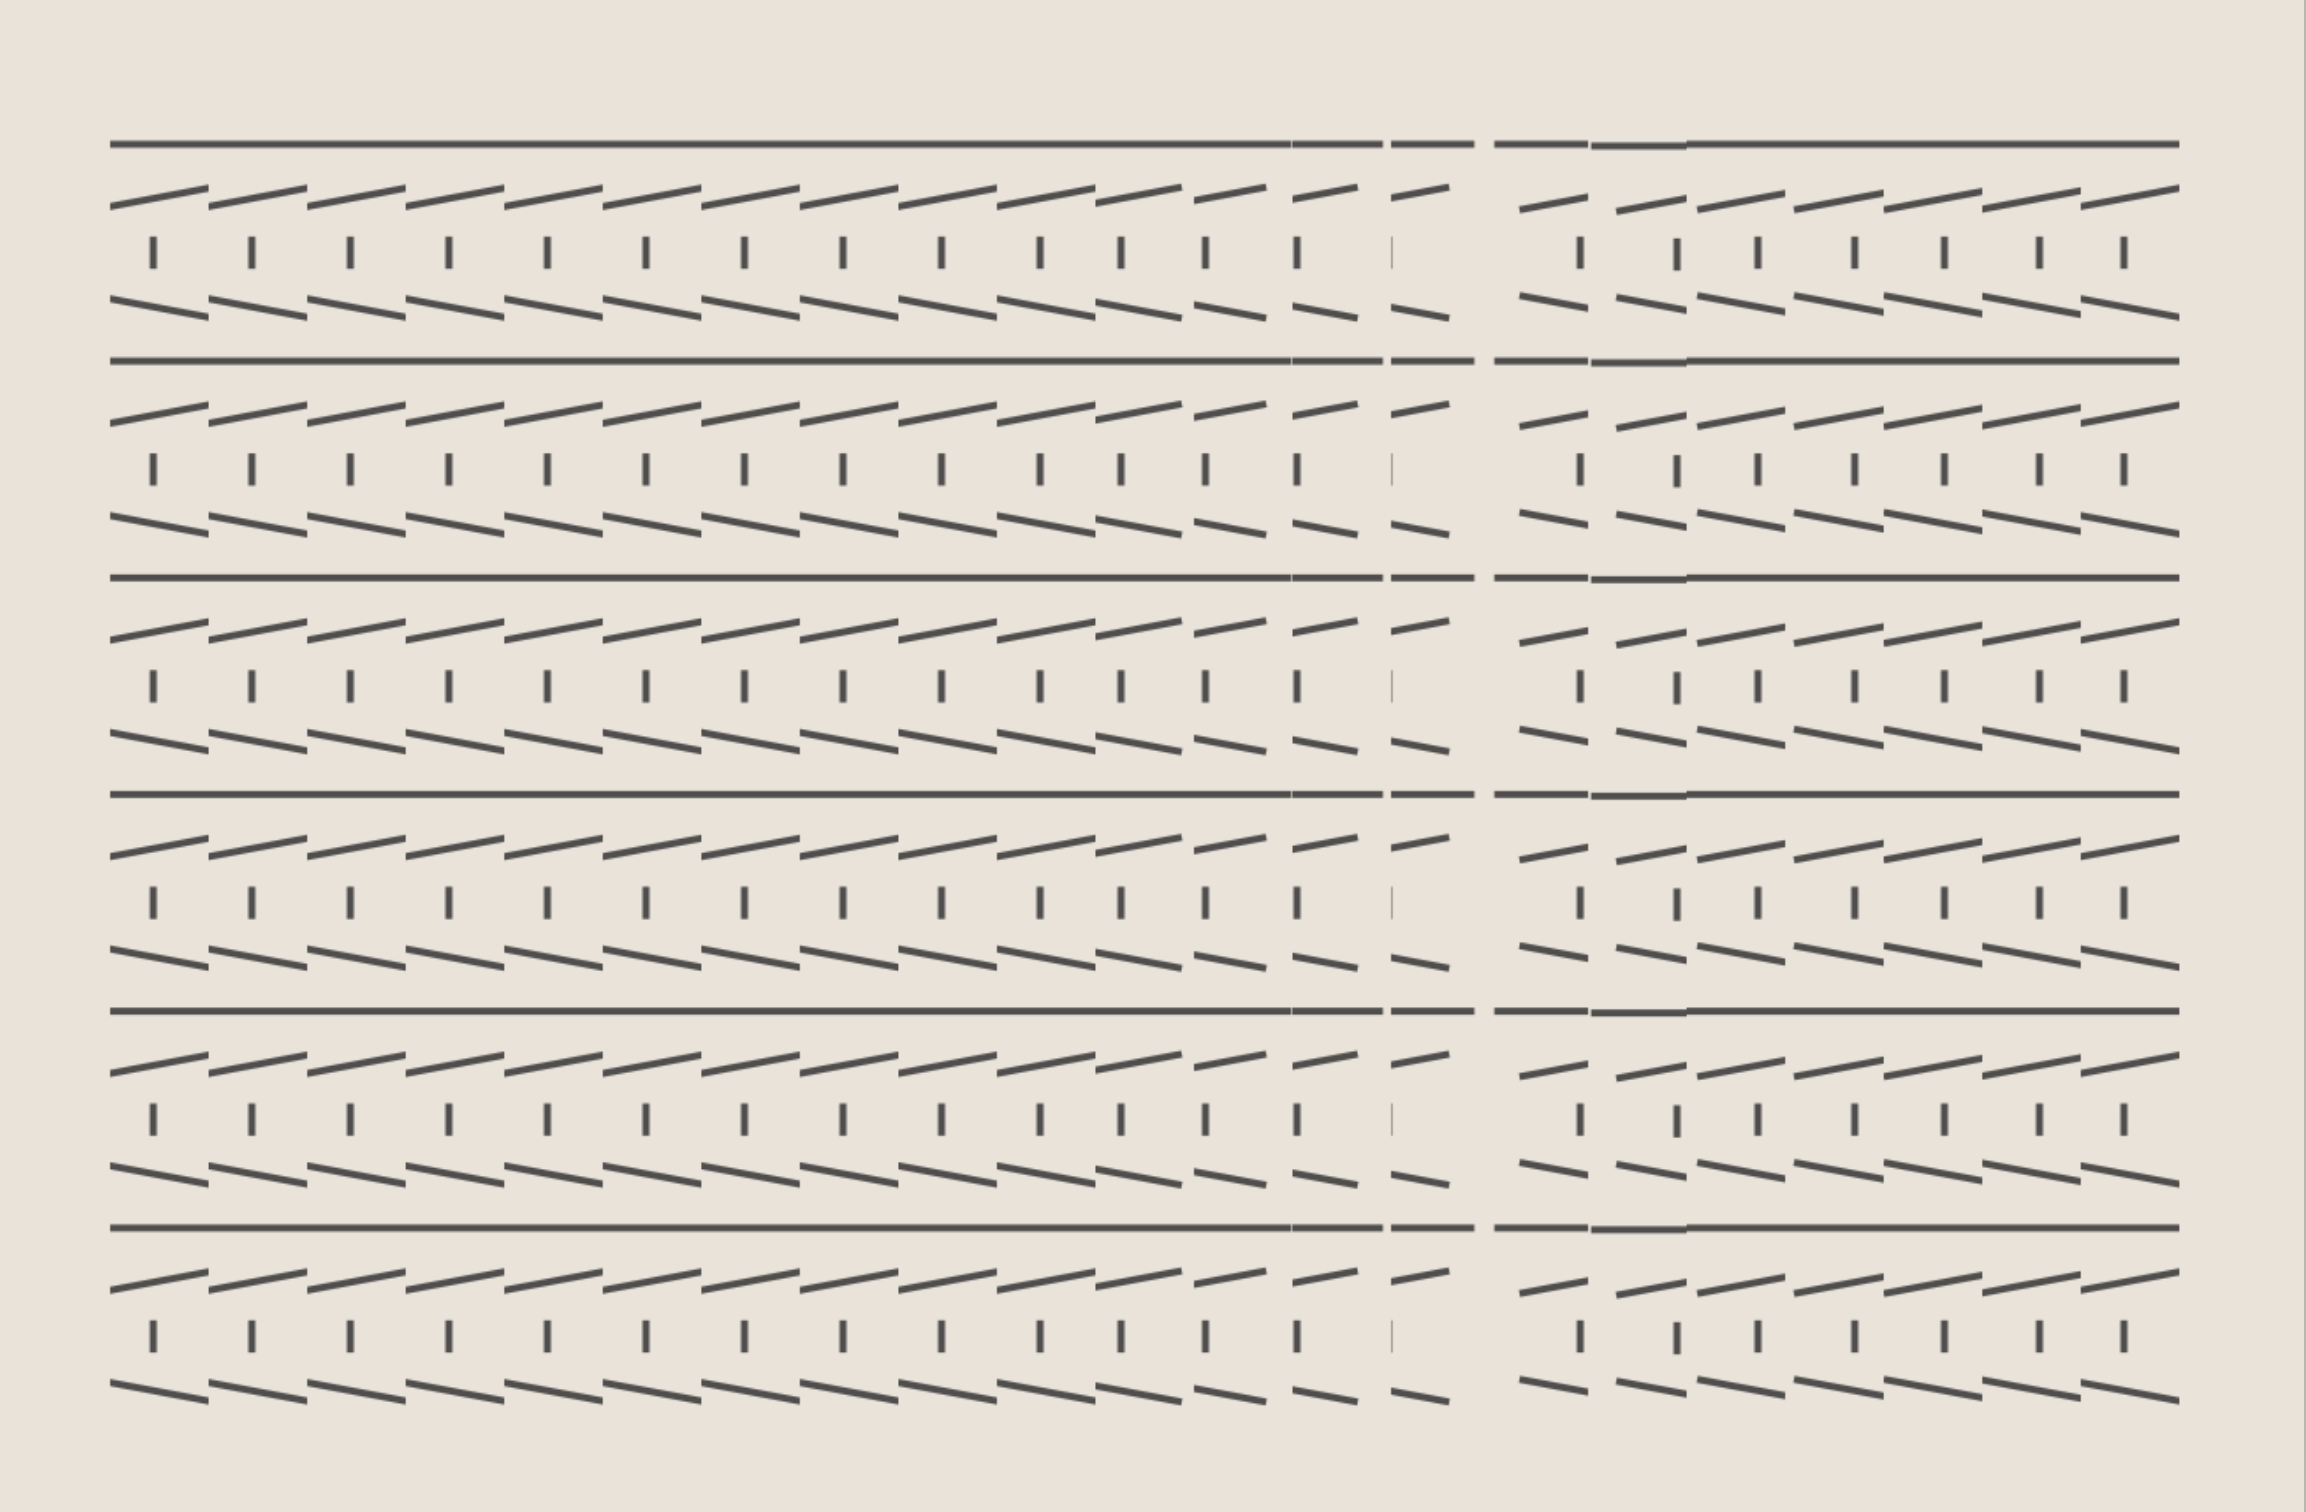
Composition 5. "Free Food (in the Zen Garden)"

For this composition I used brown noise from Tone.js. 

In the p5js editor.

After using mouseOver for prototyping, I switched over to Kinect and placed the composition on a big screen to have the user control the pattern with the movement of the right hand instead of the mouse. 


Sound

I'm uising Tone.js, written by Yotam Man.

Visuals

P5js and Adobe Illustrator.

Final Compositions

pieces_layed_out_Katya_Rozanova.jpg


Initial Mockups


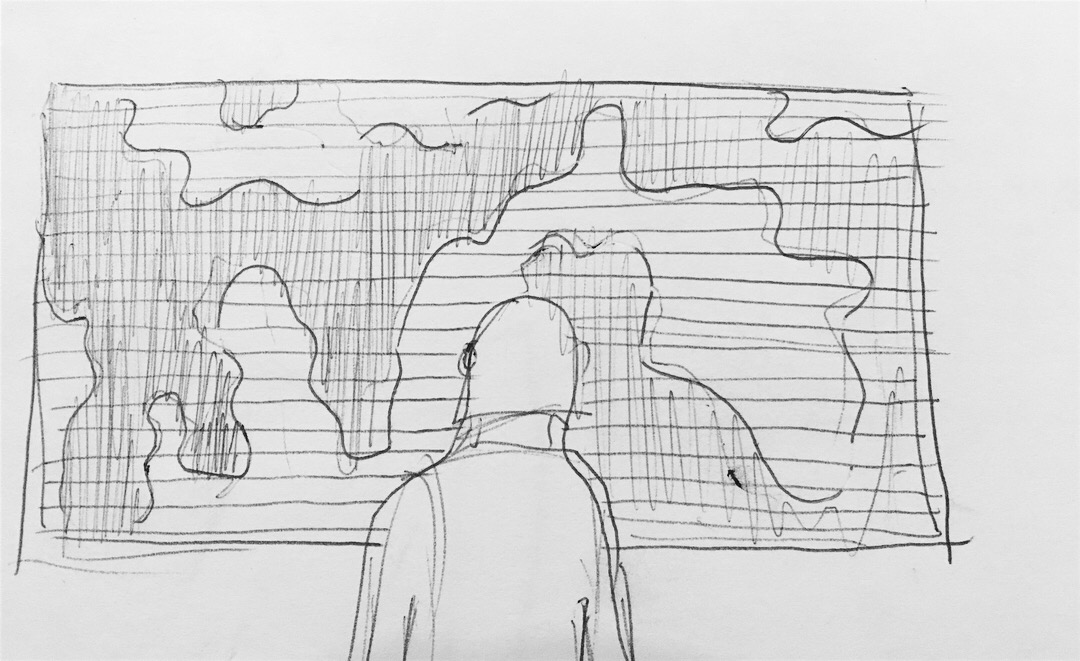
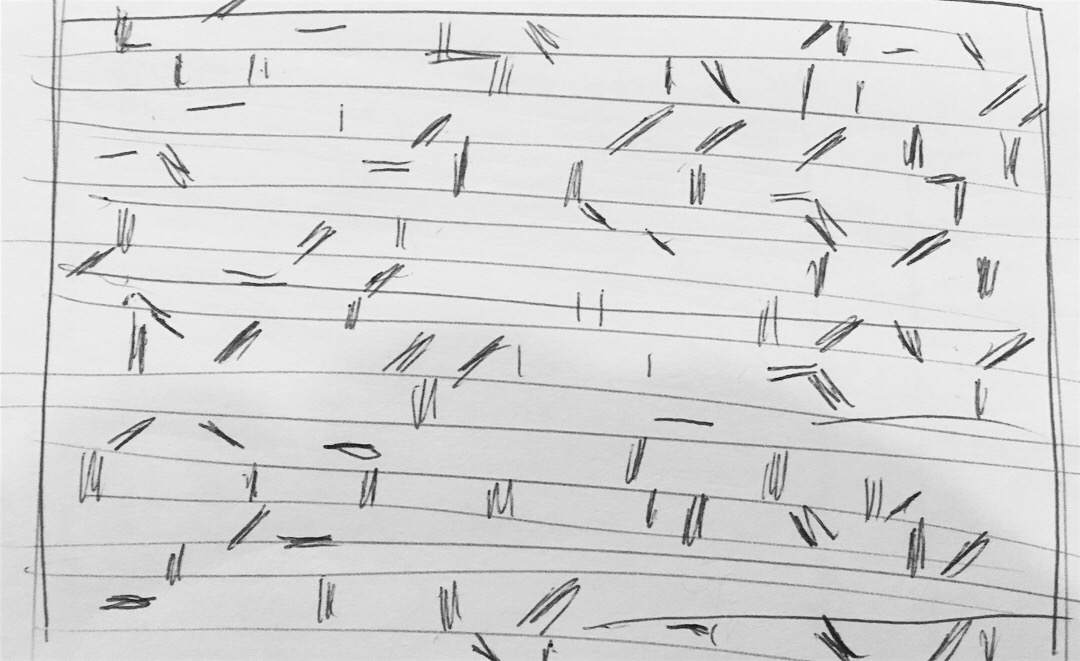
Sketches of ideas


Inspiration

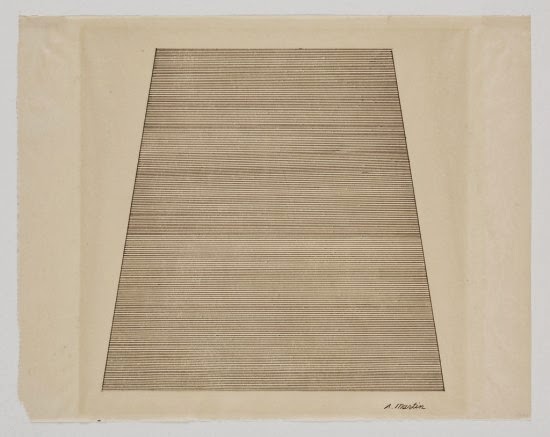
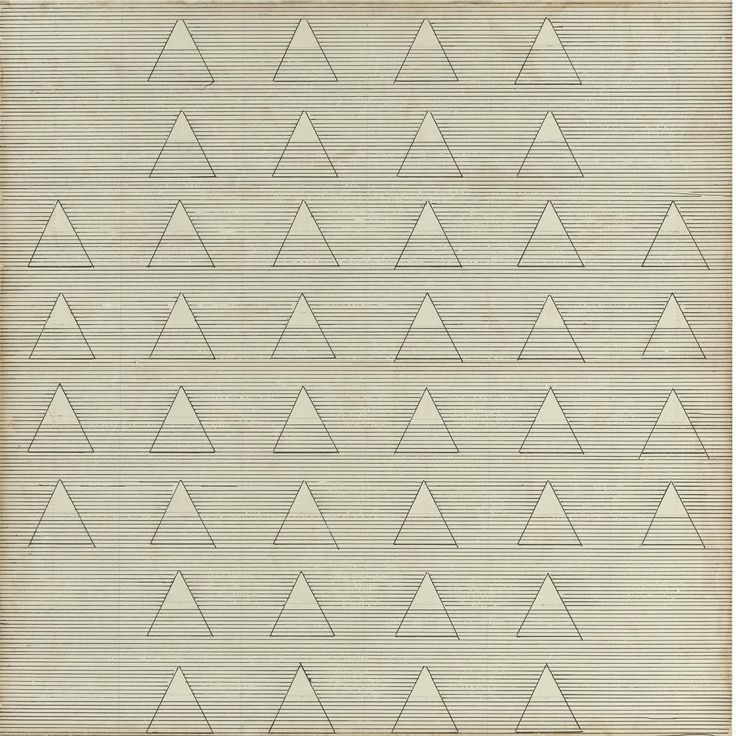
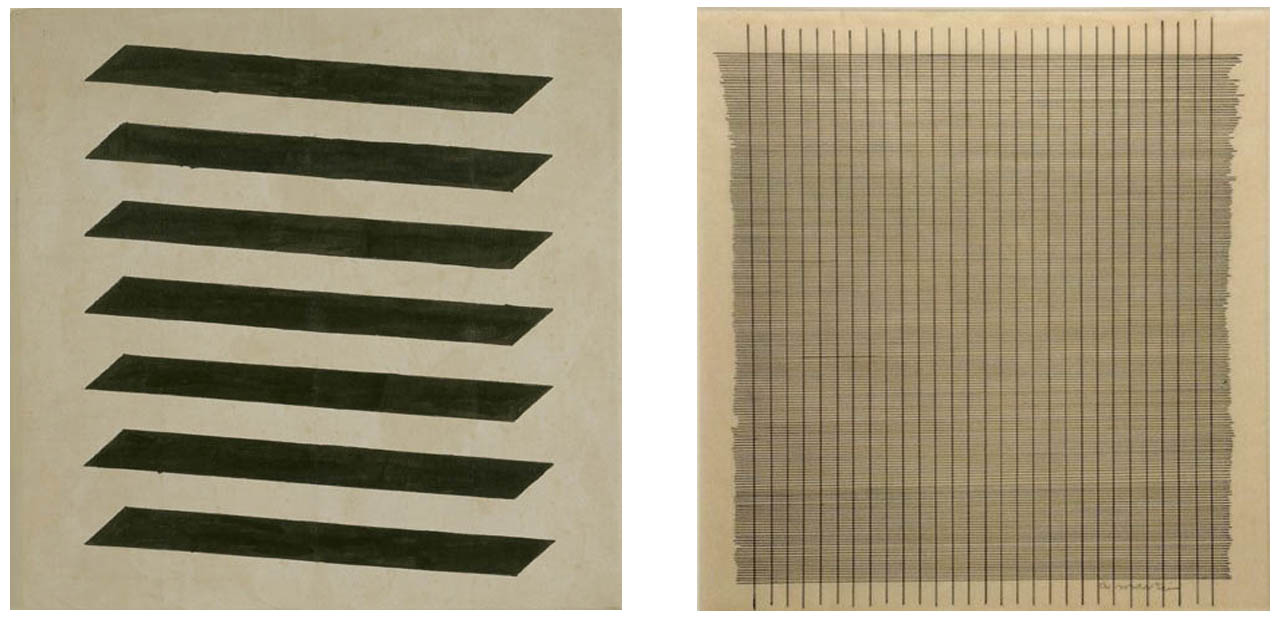
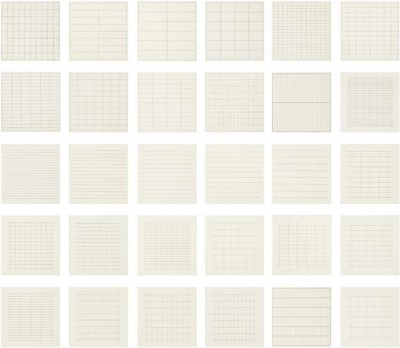
The simple grid-like designs I am creating are inspired by Agnes Martin's paintings. 

Minimalist and sometimes intricate but always geometric and symmetrical, her work has been described as serene and meditative. She believed that abstract designs can illicit abstract emotions from the viewer, like happiness, love, freedom. 


Code

Composition 1: "Ode to Leon's OCD" using mouseover code.

Composition 2: "Allison's Use of Vim Editor" with Kinectron code, using Shawn Van Every and Lisa Jamhoury's Kinectron app and adapting code from one of Aaron Montoya Moraga's workshops.

Composition 2 with mouseover for testing on computer.

Composition 3: "Isobel" with mouseover.

Composition 4 "Brother" with mouseover.

Composition 5. "Free Food (in the Zen Garden)"

Persistence Attempt

For the Dynamic Web Development course at ITP I was able to make servers that take and output data. I have made attempts to use MongoDB, a database, and JSON files to store the values users entered into the text fields in the apps I created. 


Approach one: MongoDB

While trying to run this server, I ran into an issue with the "save" property on line 114  "db.mycollection.save({"name":textvalue}, function(err, saved) {" . This was confusinf since I only had 123 lines in my code. 

I tried to find out other ways to write the code but to no avail. Every MongoDB tutorial was slightly different and Some suggested npm installing mongoose , others instructed to download Robot 3T, and nothing seemed to work. 

Screen Shot 2018-03-16 at 10.41.09 PM.png
 

Approach two: JSON files

I attempted to save data to a JSON file and simply render the data file in the ejs template. I watched these videos by Coding Rainbow and referenced this Stack Overflow page. However, that didn't seem to work. The names.JSON file in my "public" folder did not seem to take any of the code lines and remained unaltered. I have yet to make this work. For now the data collected is only on the server by way of temporary memory but it's able to spit out some input as output in a story. For now, it's as dynamic as my web development gets.


Next Steps

I'll try some more attempts at persistence soon. I need to figure out which way is better and easier, database or JSON. My hunch is that figuring out the Mongo DB will pay off because it's much more elegant and private than simply collecting all the user input and letting it live unsecured in a public server.

The result is something like this

Screen Shot 2018-03-16 at 10.35.06 PM.png

All the code can be found on my Github.

p5 Js Face

Update 0 Week 6 Assignment:

For the HTML addition assignment, I added a slider to this sketch in order to control the mouth this way.

Large GIF (394x386).gif


My first assignment in processing is a face made of shapes and curves.

I was hoping to use animation to make the mouth move around on rollover using this code but couldn't figure out how to make the movements more subtle and not have the shape follow the cursor. I found this tutorial to for a simpler interaction and used that for the interactive mouth. 

I'd like to keep trying to build something with bezier curves because I think it would be interesting to make organic shapes that undulate or recoil from the mouse like something living. I think acceleration would help here.  The single-speed interactions in the sketch below feel robotic but it's fitting to the flat, aesthetic of the composition. 

processing.gif
Sep-18-2017 00-56-36.gif

Below is a static earlier iteration where i used curves to create a unibrow and mouth. 

Screen Shot 2017-09-18 at 12.09.25 AM.png

Code

For the animated version:

function setup() {
  createCanvas(400, 400); 
  var button = createButton();

}

function draw() {
  background(236, 269, 85);


  strokeWeight(0);
  // Draw a rectangle with rounded corners having the following radii:
// top-left = 20, top-right = 15, bottom-right = 10, bottom-left = 5.

    // head
  fill (125, 255, 206);
  rect(80, 80, 240, 355, 75, 75, 45, 45);
        // left eye

  fill (random(255), random(255), random(255));


  rect(130, 130, 55, 35, 50);
  
  
  // right eye
fill (254, 190, 190);
 
  rect(220, 120, 55, 55, 50);


  //ear l
  fill (125, 255, 206);
  rect(36, 160, 85, 75, 50);
  
   //ear r
  fill (125, 255, 206);
  rect(285, 160, 85, 75, 50);
 
  //unibrow
  fill (155, 205, 206);

 stroke(205, 192, 10);

   arc(198, 85, 200, 90, PI, 0);  // upper half of circle

  // nose x, y
    fill (115, 215, 206);

    arc(210, 200, 100, 50, PI / 2, 3 * PI / 2); // 180 degrees


  //mouth before
  
  fill (12, 25, 96);

//  stroke(0);
//  beginShape();
//  curveVertex(250, 250); // the first control point
//  curveVertex(250, 250); // is also the start point of curve
//  curveVertex(230, 270);
//curveVertex(200, 280);
//  curveVertex(170, 270);
//  curveVertex(150, 250); // the last point of curve
//  curveVertex(125, 250); // is also the last control point
//  endShape();
  
  //new mouth:
    // some mouseover code i found that i wanted to make into a mouth
  //realized it's better as a toungue shape that moves with the mouse
  //x1,y1,x2,y2,x3,y3
 
  fill(205, 190, 280);
 

 translate(width/2, height/1.5);
    scale(mouseX / 800, mouseY / 800);

    fill(205, 190, 280);
    triangle(0, 20, -80, -40, 80, -40);

}
Code for the static version


function setup() {
  createCanvas(400, 400); 

}

function draw() {
  background(236, 269, 85);


  strokeWeight(0);
  // Draw a rectangle with rounded corners having the following radii:
// top-left = 20, top-right = 15, bottom-right = 10, bottom-left = 5.

    // head
  fill (125, 255, 206);
  rect(80, 80, 240, 355, 75, 75, 45, 45);
        // left eye

  fill (254, 190, 190);


  rect(130, 120, 55, 55, 50);
  
  
  // right eye
fill (254, 190, 190);
 
  rect(220, 120, 55, 55, 50);


  //ear
  fill (125, 255, 206);
  rect(36, 180, 85, 75, 50);
  
   //ear
  fill (125, 255, 206);
  rect(285, 180, 85, 75, 50);
 
  //hm
    fill (25, 25, 26);

  stroke(255, 102, 10);

    arc(195, 135, 190, 50, PI, 0);  // upper half of circle

  // nose x, y
    fill (115, 215, 206);

    arc(210, 200, 100, 50, PI / 2, 3 * PI / 2); // 180 degrees


  fill (12, 25, 96);

  stroke(0);
  beginShape();
  curveVertex(250, 250); // the first control point
  curveVertex(250, 250); // is also the start point of curve
  curveVertex(230, 270);
  curveVertex(200, 280);
  curveVertex(170, 270);
  curveVertex(150, 250); // the last point of curve
  curveVertex(125, 250); // is also the last control point
  endShape();
}
 

Meta Mounds: p5js and three force sensitive resistor buttons.

Link to the working code, which uses x and y mouse values instead of input so that one can play with this without hooking up an Arduino. 

Large GIF (740x444).gif
Large GIF (528x442).gif
Large GIF (816x440).gif

Below is a previous attempt to create this, along with the code I used to make the animation above. 


Large GIF (420x468).gif

The goal of this project was to use arrays and a constructor function to generate cleaner, compartmentalized code. I am using a shape I made (a clay model of an abstract shape that has curves, sort of reminiscent of a cartoony mountain range) and recreating it's shape using arcs. The display function uses the position of x and y (which are set to random) to place the "portrait" or linear representations of the clay shape onto the canvas.  Here is the link to the code to the P5JS editor. 

Questions

1. I am not sure how to make a step repeat pattern. It must be easy but so far I have only been able to generate linear repetitions, not evenly spread out wallpaper-like repetitions. I actually prefer the randomization, but was just curious to try a more orderly step-repeat approach. 

2. I would like to superimpose this wave over the patterns so that they block the top if the screen with the sine wave motion but I cannot get the two sets of code to coexist in one file. When i try to merge the code i get the following error: 

Uncaught TypeError: Cannot read property 'length' of undefined (sketch: line 96)

This is the code


Next Steps

The next step of this project is to use serial connection the pressure sensors on the clay shape and manipulate the amplitude, width, and speed of the wave. 

Code (with Errors)


var xspacing = 12;    // Distance between each horizontal location
var w;                // Width of entire wave
var theta = 0;      // Start angle at 0
var amplitude = 75.0; // Height of wave
var period = 400.0;   // How many pixels before the wave repeats
var dx;               // Value for incrementing x
var yvalues;  // Using an array to store height values for the wave

var sensor1;
var sensor2;
var inData;


function setup() {
  createCanvas(710, 400);
 
  w = width+12;
  dx = (TWO_PI / period) * xspacing;
  // dx =1;
  yvalues = new Array(floor(w/xspacing)); 
  // print(dx);

}

//end of setup

function draw() {
  //background(344, 54, 23);
   background(22, 22, 243);

 calcWave();
 renderWave();
  sensor1 = map(inData, 0, width, 0, 5);
 // sensor2 = map(mouseY, 0, height, 1, 3);
}


function calcWave() {
  // Increment theta (try different values for
  // 'angular velocity' here)
  
  theta += 0.02;

  // For every x value, calculate a y value with sine function
  var x = theta;
   
  for (var i = 0; i < yvalues.length; i++) {
    yvalues[i] = sensor2*sin(x * sensor1) * amplitude ;
    x+=dx;
  }
}

// for incoming serial data

function setup() {
  createCanvas(500, 300);
  colorMode(HSB,255,255,255);
  serial = new p5.SerialPort();       // make a new instance of the serialport library
  serial.on('list', printList);  // set a callback function for the serialport list event
  serial.on('connected', serverConnected); // callback for connecting to the server
  serial.on('open', portOpen);        // callback for the port opening
  serial.on('data', serialEvent);     // callback for when new data arrives
  serial.on('error', serialError);    // callback for errors
  serial.on('close', portClose);      // callback for the port closing
 
  serial.list();                      // list the serial ports
  serial.open(portName);              // open a serial port
circlecolor = color(inData, 200, 200);
  
  
  w = width+12;
  dx = (TWO_PI / period) * xspacing;
  // dx =1;
  yvalues = new Array(floor(w/xspacing)); 
  // print(dx);

  
}

function renderWave() {
  noStroke();
  fill(255);
  // A simple way to draw the wave with an ellipse at each location
  

  for (var x = 0; x < yvalues.length; x++) {
    ellipse(x*xspacing, height/105+yvalues[x], 10, -390);
  }
}
 

CODE THAT DOES WORK (but only maps to one sensor)


var xspacing = 12;    // Distance between each horizontal location
var w;                // Width of entire wave
var theta = 0;      // Start angle at 0
var amplitude = 75.0; // Height of wave
var period = 400.0;   // How many pixels before the wave repeats
var dx;               // Value for incrementing x
var yvalues;  // Using an array to store height values for the wave

var sensor1;
var sensor2;


function setup() {
  createCanvas(710, 400);
 
  w = width+12;
  dx = (TWO_PI / period) * xspacing;
  // dx =1;
  yvalues = new Array(floor(w/xspacing)); 
  // print(dx);

}

//end of setup

function draw() {
  //background(344, 54, 23);
   background(22, 22, 243);

 calcWave();
 renderWave();
  sensor1 = map(mouseX, 0, width, 0, 5);
  sensor2 = map(mouseY, 0, height, 1, 3);
}


function calcWave() {
  // Increment theta (try different values for
  // 'angular velocity' here)
  
  theta += 0.02;

  // For every x value, calculate a y value with sine function
  var x = theta;
   
  for (var i = 0; i < yvalues.length; i++) {
    yvalues[i] = sensor2*sin(x * sensor1) * amplitude ;
    x+=dx;
  }
}

function renderWave() {
  noStroke();
  fill(255);
  // A simple way to draw the wave with an ellipse at each location
  

  for (var x = 0; x < yvalues.length; x++) {
    ellipse(x*xspacing, height/105+yvalues[x], 10, -390);
  }
}